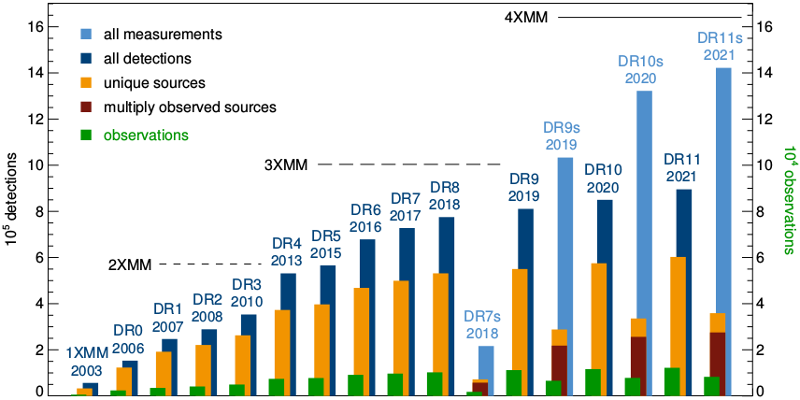
Catalogue 4XMM-DR11s

The 4XMM-DR11s catalogue of serendipitous sources from overlapping XMM-Newton observations has been compiled from 1 475 groups of 8 292 selected overlapping XMM-Newton observations. They were taken between 2000 February 3 and 2020 December 17 and overlap by at least one arcminute in radius. The catalogue contains 358 809 unique sources, 275 440 of them multiply observed, with positions and source parameters like fluxes in the XMM-Newton standard energy bands, hardness ratios, quality estimate, and information on inter-observation variability. The parameters are directly derived from the simultaneous fit, and, wherever applicable, additionally calculated for each contributing observation. The catalogue aims at exploring the multiply observed sky regions and exploit their survey potential, in particular to study the long-term behaviour of X-ray emitting sources. It thus makes use of the long(er) effective exposure time per sky area and offers the opportunity to investigate flux variability directly through the source detection process. The main catalogue properties are summarised in the table below, the data processing and the stacked source detection are described in the processing summary. Updates compared to the previous version include a significantly larger sample of observations, event-based astrometric corrections before running source detection, revised background parameters, and manually set flags marking obviously spurious detections. More information is provided in the latest version of the Documentation.
The catalogue is available for download as a single file xmmstack_v2.2_4xmmdr11s.fits.gz [1.2 GB] in FITS format and browsable via the web-based interfaces
The XSA provides access to the auxiliary data products per source: a broad-band X-ray image, a colour-coded three-band X-ray image, an optical finding chart, and a long-term X-ray light curve. xmmssc.aip.de provides access th the axiliary data products per stack: broad-band and energy mosaic images, coverage maps including the number of observations and exposures, and exposure maps, all in FITS format.
The list of observations and stacks processed to create 4XMM-DR11s is available in FITS format: xmmstack_v2.2_4xmmdr11s_obslist.fits.gz [1.6 MB] From two stacks, the deepest regions were excluded from the processing for technical reasons: the innermost part of M31 and the Galactic Centre.
| 4XMM-DR11s | 4XMM-DR10s | 4XMM-DR9s | 3XMM-DR7s | |
|---|---|---|---|---|
| Number of stacks | 1 475 | 1 396 | 1 329 | 434 |
| Number of observations | 8 292 | 7 803 | 6 604 | 1 789 |
| First observation included | 2000/02/03 | 2000/02/03 | 2000/02/03 | 2000/02/20 |
| Last observation included | 2020/12/17 | 2019/12/14 | 2018/11/13 | 2016/04/02 |
| Approximate sky coverage | 560 sq. deg. | 540 sq. deg. | 485 sq. deg. | 150 sq. deg. |
| Approximate multiply observed sky area | 350 sq. deg. | 335 sq. deg. | 300 sq. deg. | 100 sq. deg. |
| Total number of sources | 358 809 | 335 812 | 288 191 | 71 951 |
| Sources with several contributing observations | 275 440 | 256 213 | 218 283 | 57 665 |
| Multiply observed sources with flag 0 or 1 | 233 542 | 216 699 | 191 497 | 55 450 |
| Multiply observed and flagged manually | 25 662 | 24 296 | 19 224 | – |
| Multiply observed with a total detection likelihood of at least six | 224 178 | 208 921 | 181 132 | 49 935 |
| Multiply observed with a total detection likelihood of at least ten | 189 556 | 176 680 | 153 487 | 42 077 |
| Multiply observed point sources with VAR_PROB≤1% and flag 0 or 1 | 23 424 | 21 672 | 20 588 | 5 358 |
| Multiply observed point sources with VAR_PROB≤10–5 and flag 0 or 1 | 8 326 | 7 728 | 7 478 | 1 839 |
| Maximum number of observations per source | 65 | 65 | 40 | 23 |
| Maximum on-time per source | 2.8 Ms | 2.8 Ms | 1.9 Ms | 1.3 Ms |
 Increasing content of the XMM-Newton Serendipitous Source Catalogues

