Organisation of the catalogue
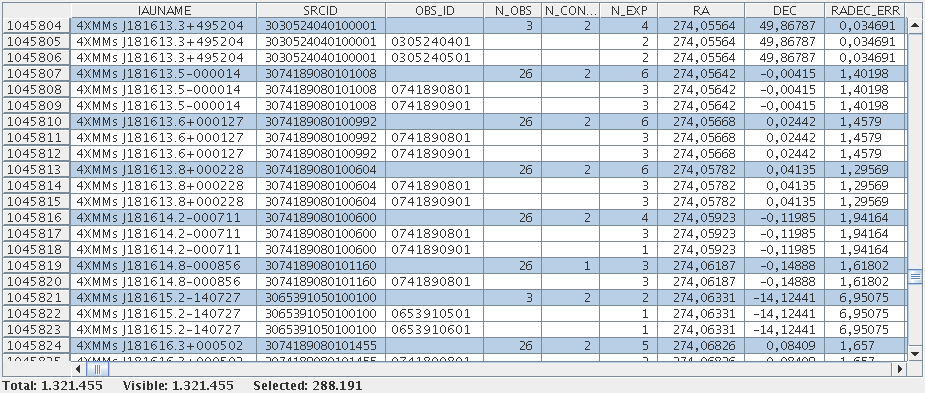
 Topcat view of catalogue sources. All-stack rows have blue background, observation-level rows have white background.
For each group of observations, stacked source detection is run using the new task edetect_stack. The stacked catalogue is constructed from the resulting unique source lists and comprises all sources in the catalogue observations. More than 75% of them are detected in overlap area, the rest were observed only once (typically in the outer field of view). The catalogue lists the parameters from the combined fit for each source and, in addition, one line for each observation that was involved in this fit. All source parameters are directly derived from the results of the simultaneous fit to all observations in a stack. Values per observation refer to the subset of images taken during this observation. The catalogue can be reduced to the one-source-one-row layout of the 4XMM source catalogues using a selection expression on the identifier columns described below such as N_CONTRIB. Its columns are mostly organised in the style of the 4XMM catalogues with the same definitions of their values as in the classical catalogues, wherever applicable, and are fully listed in Traulsen et al. 2020. This section describes the most relevant parameters, modifications to the 4XMM column definitions, and newly introduced columns.
Source identifier. The unique source identifier in the stacked catalogue is a 16-digit number, composed by (i) a preceding 3, continuing the 3XMM and 4XMM convention that the detection identifier of individual detections starts with a "1" and the source identifier of unique matches between them starts with a "2", followed by (ii) the lowest OBS_ID of the contributing observations (10 digits), and (iii) the identifier within the emldetect source list (5 digits), for example 3020624020100030 for the thirtieth detection in a stack with 0206240201 being the lowest identifier of all the observations during which the detection was in the field of view. The five-digits identifiers are not continuous, because the temporary emldetect source list comprises all input detections, true or spurious, and only the significant ones among them are transferred to the final source list.
Each source is attributed a unique IAUNAME of the form "4XMMs hhmmss.s±ddmmss", composed of the identifier "4XMMs" and the truncated sexagesimal right ascension and declination of the source. "s" stands for its origin in the stacked catalogue.
Observations included. Column N_OBS gives the total number of observations per stack, column N_CONTRIB the number of contributing observations for which the source position is inside the field of view. Both column values are set to null in the observation-specific rows and can thus be used to select the summary rows per source, for example by the expression "N_CONTRIB > 0". N_EXP gives the number of exposures, i.e. the number of active instruments, and is set in each row of the catalogue. The boolean OVERLAP indicates whether a source was detected in an overlap region.
Source coordinates. The position of the source is the result of the simultaneous fit and considered to be the same in all contributing observations and images, while the number of source counts are determined separately per image. They are given in equatorial, galactic and image coordinate systems in the RA, DEC, LII, BII, and X_IMA, Y_IMA columns, respectively. Image coordinates refer to the images of the combined observations of a stack in their common coordinate system and are listed together with their 1σ errors. The combined position error RADEC_ERR is the square root of the sum of the squared 1σ errors on the image coordinates. For symmetric errors in both dimensions, RADEC_ERR divided the square root of two is the one-dimensional 1σ position error, giving the coordinate interval that includes 68% of normally distributed data points. RADEC_ERR times the square root of 2.3/2 is the two-dimensional error, giving the radius of a circularised ellipse that includes 68% of normally distributed data points.
Equivalent likelihoods. Maximum detection likelihoods are determined per input image, summed, and converted from the total number of degrees of freedom to the equivalent of a two-parameter fit. For the stacked catalogue, sources with an equivalent likelihood of at least six over the whole stack or for at least one contributing observation are selected.
Source flux. The fitted count rate per image is converted into flux using the energy conversion factors of the 3XMM and 4XMM catalogues. All-EPIC source fluxes are error-weighted means of the fluxes per instrument and observation. They are null with undefined flux errors, but non-zero count errors for an observation if no counts are found within the PSF area of a source. The ECFs depend on the instrument, the observing mode, and the filter used, on the off-axis position of the source, and on its spectral shape. Therefore, the combined fluxes merging different instruments and merging different instrumental setups across the observations are affected by cross-calibration uncertainties. The underlying spectral model of the ECFs is an absorbed power law with a column density of 3×1020 cm–2 and a photon index of 1.7.
Source extent. The radial extent of a source is parameterised via a beta model and fit simultaneously in all observations. Sources with an extent below 6″ or an extent likelihood below 4 cannot be resolved and are considered point-like. Their source extent is set to zero.
Mask fraction. The PSF-weighted detector coverage of a source is given for each instrument separately. During an observation, it is conservatively defined like in the other XMM catalogues as the minimum mask fraction of the five energy bands, indicating the most restrictive mask. The stacked mask fraction is the largest mask fraction of the contributing observations, indicating the best observation.
Source flags. A modified version of the SSC internal task dpssflag, the task also in use for the 3XMM catalogues, is employed for an automated quality flagging to warn the user about complexities in the environment of the source that might affect the significance of the detection or the source parameters and their accuracy. Strings of nine booleans per instrument indicate different potential issues of a detection, described inthe Section on quality assessment and the Table. The nine booleans are converted to a single integer summary flag STACK_FLAG. Sources with a flag value of "0" come without any warning. Flag "1" indicates reduced detection quality: low detector coverage or a source position close to another source or to bad detector pixels. The list of known bad pixels is hard-coded within the task dpssflag. "2" is attributed to potentially spurious sources, for example those found within the PSF radius of another source. A flag value of "3" in the summary row indicates that the source has received flag 2 in several contributing observations. The integer flags are not directly comparable with the integer SUM_FLAG in the other 3XMM catalogues, which have been set for individual observations.
Long-term variability between observations. Five new sets of source parameters provide information on the inter-observation variability of a source directly from the source fluxes and their errors. Each of them is determined from the all-EPIC fluxes in all contributing observations and from the fluxes in each of the five standard energy bands separately, i.e. has got six columns in total.
VAR_CHI2 is a reduced chi square of flux variability between the all-EPIC flux over all observations and the individual fluxes per observation. The associated VAR_PROB describes the probability that the observed flux values are consistent with constant source flux over all observations. It is the cumulative chi-square probability to reach at least VAR_CHI2 in the given number of input images. A low value of VAR_PROB thus indicates a high chance that the source shows inter-observation flux variability.
FRATIO gives the ratio between the highest and lowest value of the fluxes per observation, and FRATIO_ERR its 1σ error.
FLUXVAR is the largest difference between pairs of fluxes per observation in terms of sigma.
In recent catalogue versions, information on flux-ratio variability between different combinations of the standard energy bands are provided as well.
Observation characteristics. Each row per observation includes the modified Julian dates of its start and end time. In the summary row per source, the MJDs of the beginning of the first and the end of the last contributing observation are given. Filter, instrument submode, and mean position angle of the spacecraft are listed per observation.
Columns copied from the catalogue from individual observations. Since the stacked catalogue is based on a subset of the observations in the catalogue from individual observations, its sources have been positionally cross-matched with the good-quality so-called unique sources. Two sources are associated if their separation is no larger than the sum of three times the positional uncertainty of each source. For the sources in the catalogue from overlapping observations, the pure statistical position error RADEC_ERR is used, and for the unique sources in the catalogue from individual observations, their combined SC_POSERR. The error sum is assumed to be at least one arcsecond to account for systematic errors. For each associated unique source, information on position, quality flag, and intra-observation variability are copied to the summary rows of the stacked catalogue. The observation-specific rows list the parameters of the individual detection that contributes to the unique source, if one is found. Column DIST_4XMMDRx gives the distance between the stacked detection and the counterpart.
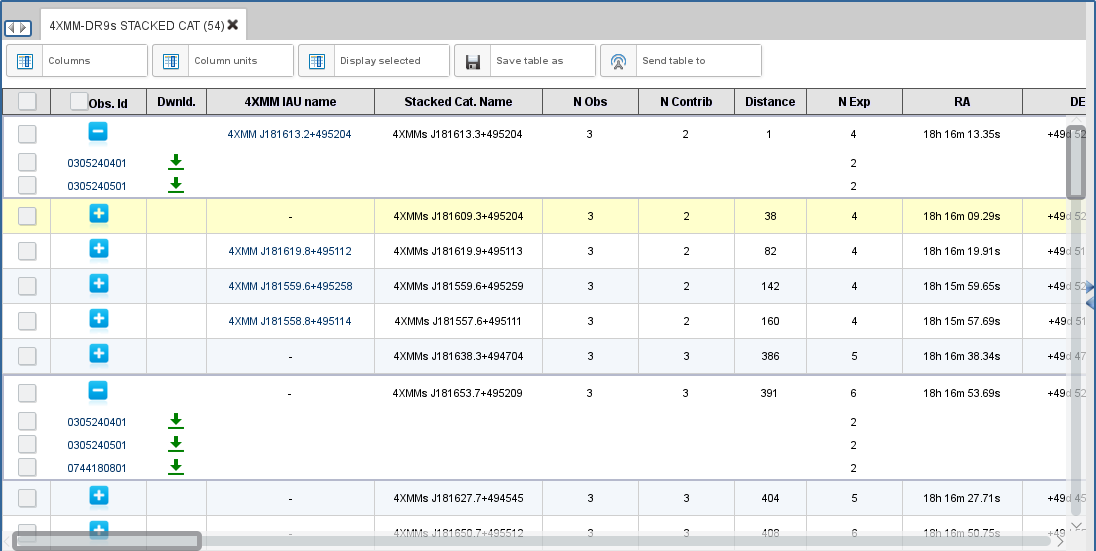
 Catalogue sources in the XSA interface. A click on the plus sign opens the observation-level rows with the option to download the observation data. For stacked sources with a counterpart in the catalogue from individual observations, the 4XMM IAUNAME and a link to the catalogue entry are provided.

