Auxiliary products
Auxiliary stack data
For each stack, eleven combined files in FITS format are provided: * six mosaic images in the full 0.2–12.0 keV band and for each of the standard bands 0.2–0.5 keV, 0.5–1.0 keV, 1.0–2.0 keV, 2.0–4.5 keV, 4.5–12.0 keV, * three coverage maps indicating un-exposed (0) and exposed (1) pixels, the number of observations covering a sky pixel, and the number of exposures covering a sky pixel, * and an un-vignetted and a vignetting-corrected exposure map.
They can be accessed through the AIP Query interface, the Stack viewer, or scripting.
Auxiliary source images
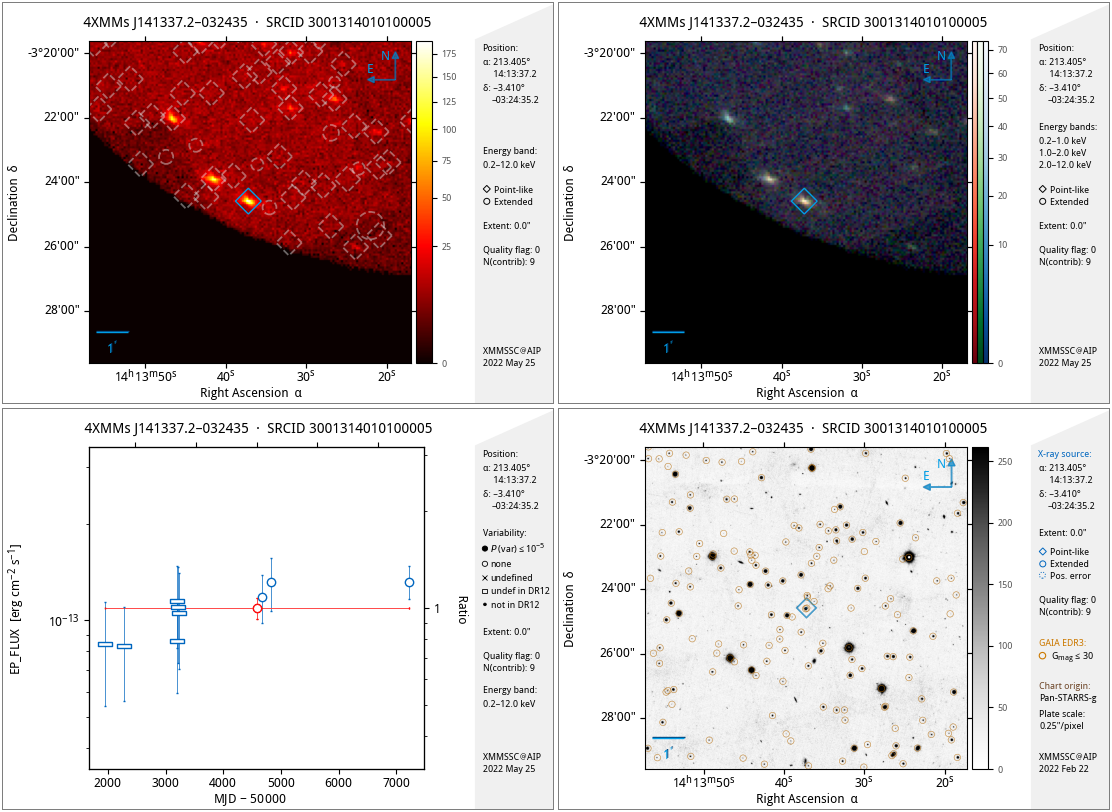
Four types of auxiliary images are produced for the stacked catalogue and provided in the XSA interface:
- a broad-band X-ray image in the 0.2–12.0 keV range,
- a three-colour X-ray image in the energy bands 0.2–1.0 keV, 1.0–2.0 keV, 2.0–12.0 keV, corresponding to the 4XMM standard energy bands 1 plus 2, 3, and 4 plus 5,
- an optical finding chart, taken from the first survey that covers the source position among Pan-STARRS g-band imaging, SDSS g-band imaging, DESI Legacy Imaging Surveys, or broad-band data of the ESO Digitized Sky Survey,
- and, if the source has non-zero flux during at least two observations, a long-term light curve, showing the stacked EPIC flux value and the EPIC flux during the contributing observations. Different plot symbols are used to indicate tentative short- and long-term variability. The stacked flux is plotted with a filled circle, if the probability VAR_PROB is 10–5 or lower. It indicates whether the source fluxes are consistent with being constant or not.
All images have a side length of 10 arcminutes, are centered at the X-ray source position, and are annotated with information on the position and detection quality.


